

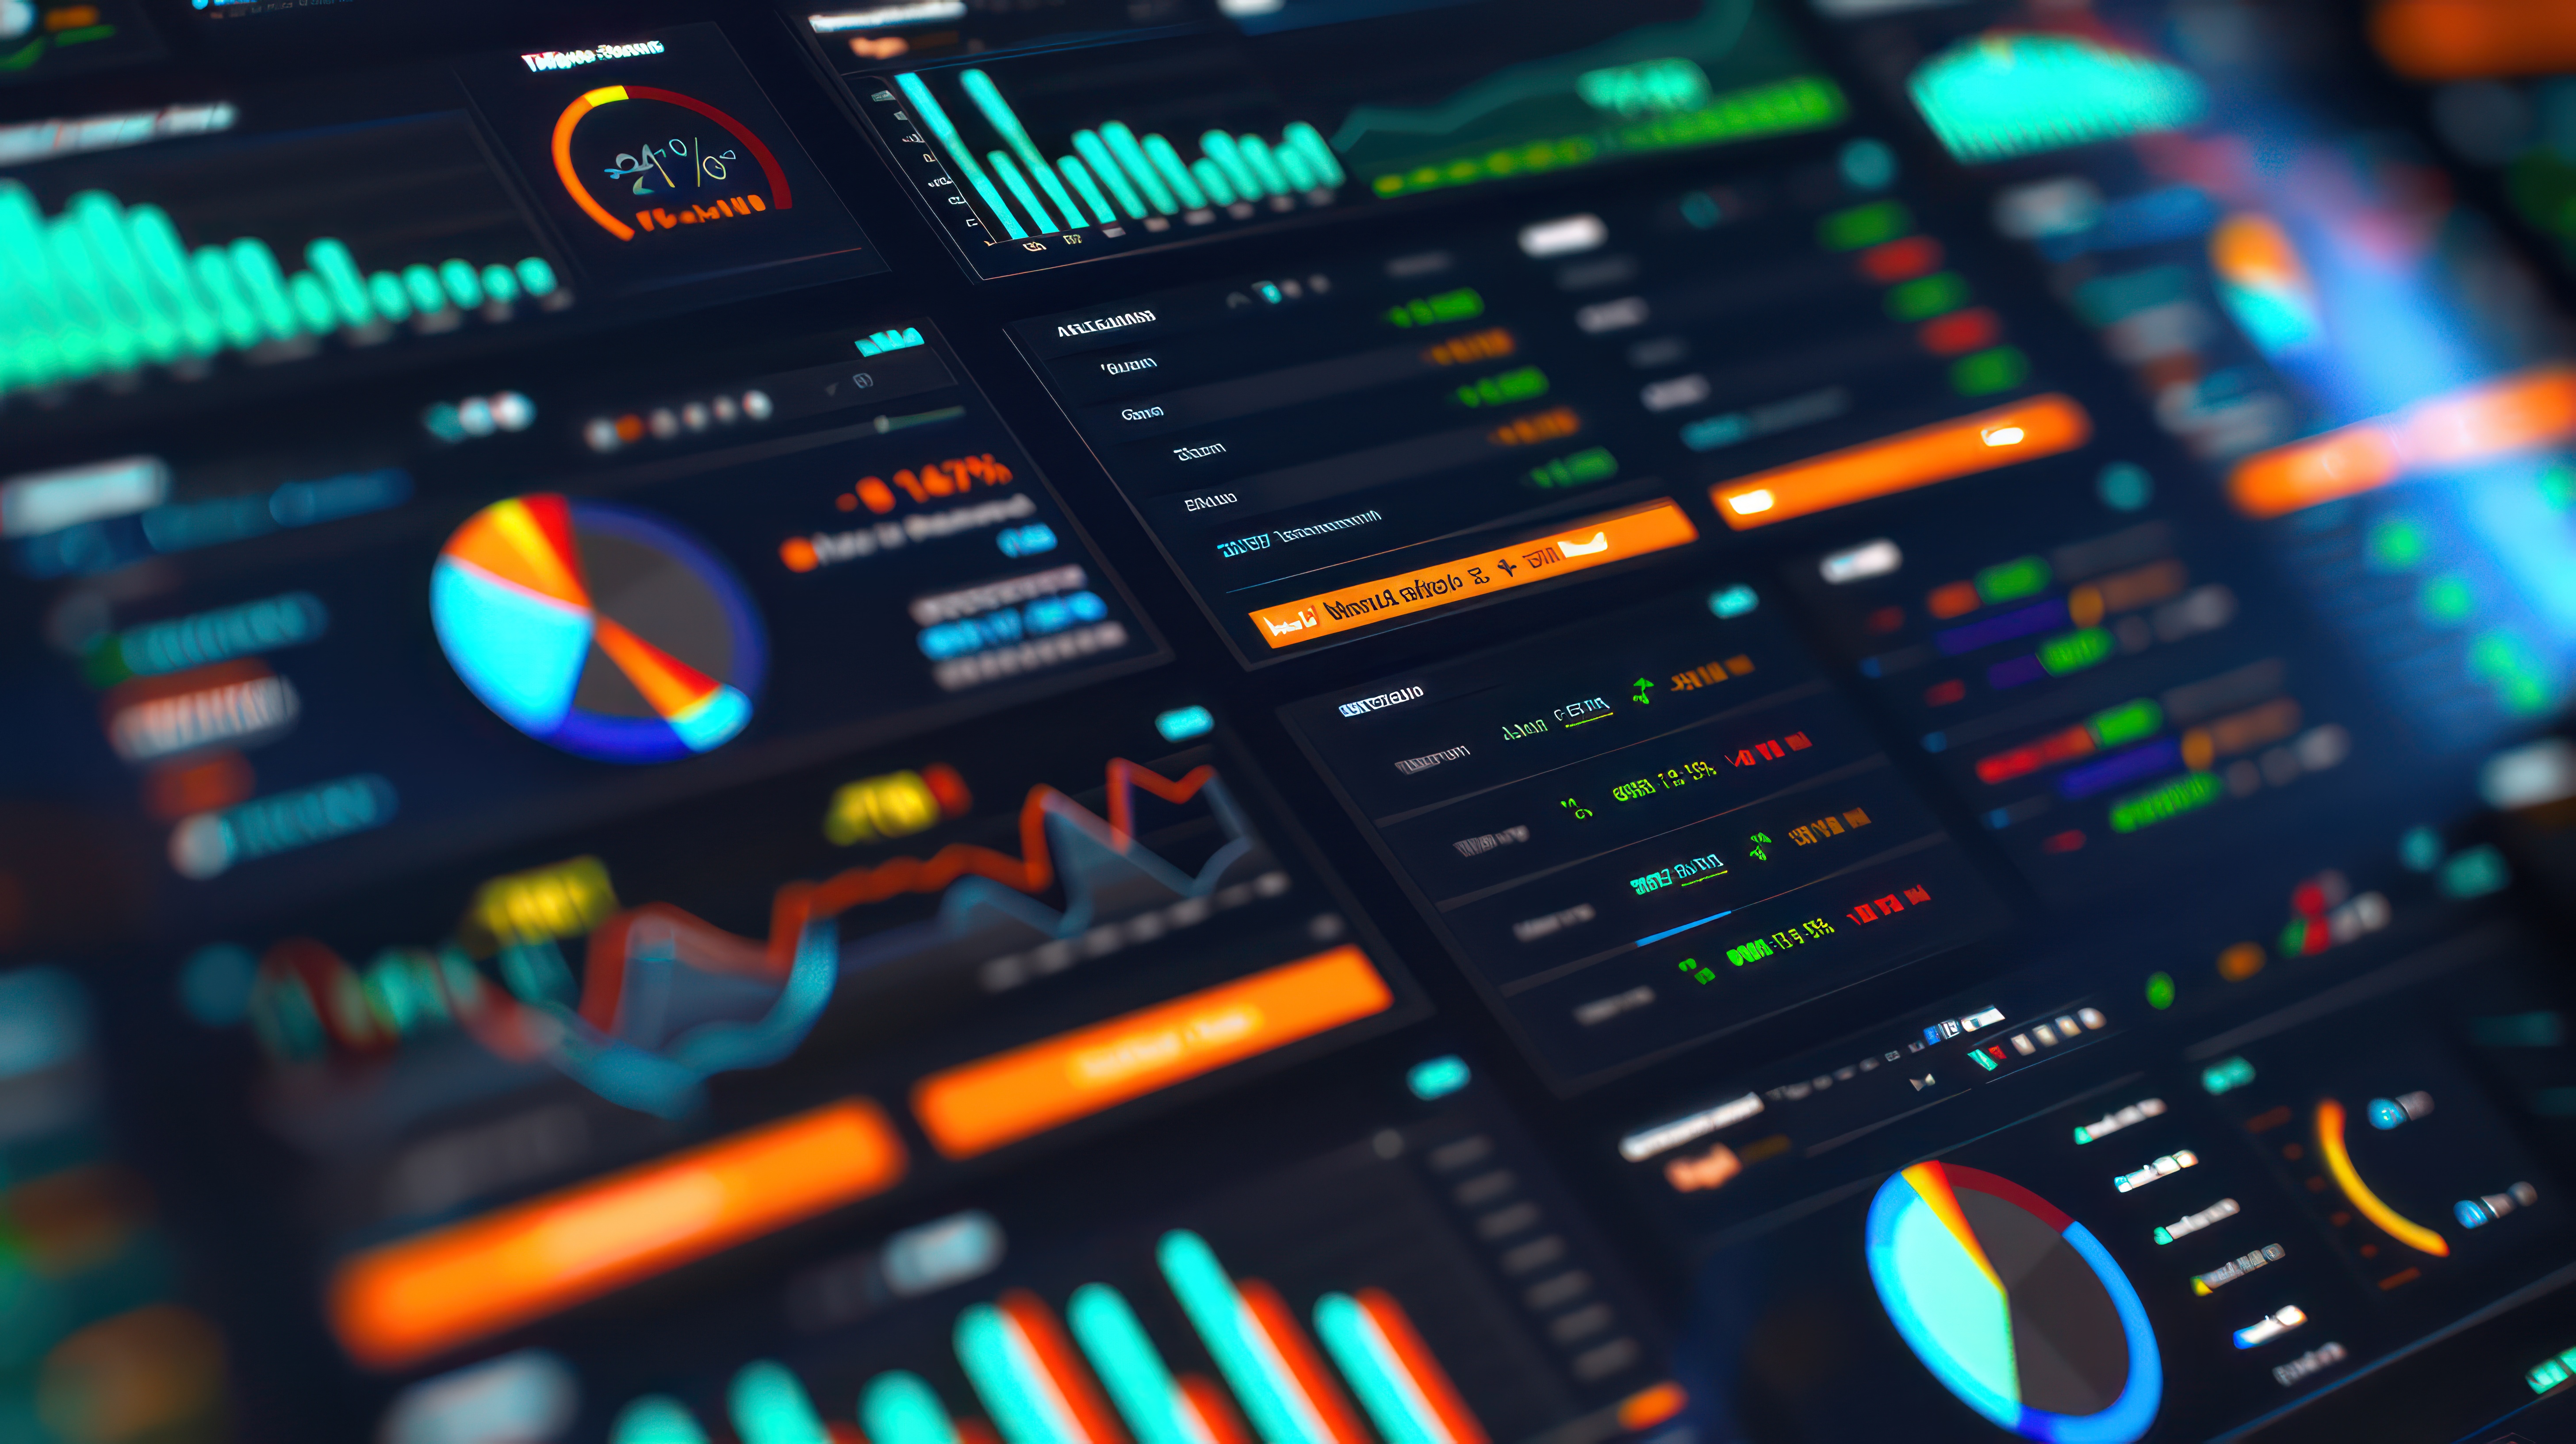
In the competitive landscape of the travel industry, data is the new currency. Tour operators are inundated with data from various sources—booking systems, customer reviews, social media, and more. However, raw data is only as valuable as the insights it provides. This is where data visualization, or "data stories," comes into play. By transforming complex data into intuitive graphs and visual representations, tour operators can uncover valuable business insights that drive informed decision-making. This blog explores how data visualization aids quick analysis and shares case studies on leveraging data stories to analyze business growth and decline.
How Data Visualization Aids Quick Analysis
1. Simplifying Complex Data
Data visualization simplifies complex datasets, making it easier for tour operators to understand and interpret the information. Instead of sifting through endless rows of numbers, operators can quickly grasp trends and patterns through visual representations such as charts, graphs, and dashboards. This simplification is crucial for timely decision-making, especially in a fast-paced industry like travel.
2. Enhancing Comprehension and Communication
Visual data is more accessible and easier to comprehend than raw data. When data is presented visually, it tells a story that can be quickly understood by stakeholders at all levels. This is particularly important for communicating insights to non-technical team members, partners, and investors. Effective data visualization ensures that everyone is on the same page, facilitating better collaboration and strategic planning.
3. Enabling Real-Time Insights
With modern BI tools, data visualization can be dynamic and interactive, allowing tour operators to gain real-time insights. Operators can monitor key performance indicators (KPIs) such as booking rates, customer satisfaction scores, and revenue metrics in real-time, enabling them to respond promptly to emerging trends and issues. Real-time insights are essential for maintaining a competitive edge and optimizing operations.
4. Identifying Trends and Patterns
Data visualization helps identify trends and patterns that might not be evident in raw data. For example, a heatmap can reveal peak booking times, while a line graph can illustrate seasonal demand fluctuations. By recognizing these trends, tour operators can adjust their marketing strategies, pricing models, and resource allocation to align with customer behavior and market dynamics.
Case Studies on Growth and Decline Analysis
Case Study 1: Identifying Seasonal Trends
A mid-sized tour operator specializing in adventure travel used data visualization to analyze booking data over several years. By creating line graphs and heatmaps, they identified clear seasonal trends and peak booking periods. This insight allowed them to optimize their marketing efforts, targeting customers with special promotions during off-peak seasons. As a result, they achieved a 20% increase in off-season bookings and a more balanced revenue stream throughout the year.
Case Study 2: Analyzing Customer Feedback
Another tour operator used sentiment analysis and data visualization to interpret customer reviews and feedback from multiple platforms. By creating sentiment heatmaps and word clouds, they identified recurring issues related to tour guides and accommodation quality. These insights led to targeted improvements in guide training and the selection of accommodation partners. Following these changes, customer satisfaction scores improved by 15%, and repeat bookings increased significantly.
Case Study 3: Monitoring Marketing Campaign Performance
A tour operator focused on luxury travel used data dashboards to monitor the performance of their digital marketing campaigns. By visualizing metrics such as website traffic, conversion rates, and social media engagement, they could quickly identify which campaigns were most effective. This allowed them to allocate their marketing budget more efficiently, resulting in a 25% increase in conversion rates and a higher return on investment (ROI).
Conclusion
Data visualization transforms raw data into compelling data stories, providing tour operators with the insights needed to drive business growth and address challenges. By simplifying complex data, enhancing comprehension, enabling real-time insights, and identifying trends and patterns, data visualization empowers tour operators to make informed decisions that enhance their operations and customer experiences.
As the travel industry continues to evolve, the ability to turn data into actionable insights will be a key differentiator for successful tour operators. Investing in advanced BI tools and developing a culture of data-driven decision-making will not only improve operational efficiency but also foster innovation and growth. By leveraging the power of data stories, tour operators can stay ahead of the competition and thrive in a dynamic market.