Try a thought experiment. You ran a $4,000 Google Ads campaign last month. By the end of the month, you had a strong booking month. Direct bookings were up. Your tour-specific brand searches on Google were up. OTA bookings of your product were also up.
How much of any of that did the Google Ads campaign actually cause?
The honest answer, for most of us, is that we have no idea. The attribution math that makes sense for ecommerce companies selling direct breaks down when half our bookings come through OTAs whose data we can't see, when a customer might see our ad on Tuesday and book through Viator on Friday, and when our most reliable demand driver might be word-of-mouth that doesn't show up in any platform's analytics at all.
This is the marketing problem nobody really wants to talk about, because the honest version of it is uncomfortable. We're spending money. We can't fully measure what we're getting. The OTAs can measure their own contribution. We're often guessing at ours.
This piece is about how to guess less.
Why Standard Attribution Doesn't Work for Us
Most digital marketing measurement is built on the assumption that the buyer's journey takes place on platforms whose data you can see. Customer clicks Google ad, lands on your site, browses, buys. Standard analytics tracks the chain. You know the ad caused the booking, and you can calculate ROI.
In our industry, the chain breaks at multiple points.
The customer who clicks your Google ad might bounce back to search results, click an OTA listing, and book there. The Google ad caused the booking, but the booking shows up in the OTA's dashboard, not yours.
The customer who saw your Instagram post might book three weeks later after also seeing four other things, including a magazine recommendation, a friend's recommendation, and a final search that took them to GetYourGuide. Your Instagram contribution is real but invisible.
The customer who found you through a friend's word-of-mouth might book directly on your site after searching your business name. Your analytics will show this as a "direct" or "brand search" booking, with no marketing attribution. The actual cause (the friend's recommendation, possibly itself caused by a prior customer experience driven by some past marketing activity) is lost.
The customer who saw a paid ad and then went to an OTA the OTA gets credited in their own analytics. Your ad spend looks ineffective in your dashboards, even though it drove the OTA booking.
The cumulative effect: our analytics dashboards systematically under-credit our brand and direct-channel marketing, and over-credit our last-touch interactions.
The "Dark Funnel" Problem
A term that's started to appear in marketing conversations and that captures the issue well: the dark funnel.
For tour operators, the dark funnel is the part of the customer journey that happens off any platform you can measure. The Instagram screenshot that gets sent in a group chat. The recommendation in a travel forum. The conversation with a hotel concierge. The mention in a guidebook. The customer's own memory of seeing your name three months ago.
These touchpoints absolutely drive bookings. They might drive more of our bookings than any of the platforms we can measure. And we have essentially no visibility into them.
The first move toward better marketing measurement is to acknowledge that the dark funnel exists, is large, and won't be solved by any analytics platform that promises to "track every touchpoint." That promise is, in our industry, marketing hype.
What You Can Actually Measure With Confidence
Given the limitations above, what is actually measurable?
A few things, when measured properly, give honest signal.
Brand search volume over time. The total number of monthly searches for your business name on Google. This is the closest thing we have to a clean awareness metric, because brand searches usually indicate that something prompted the customer to look us up. Brand search trends respond, with a lag, to marketing activity that builds awareness.
Direct booking volume relative to total volume. Direct bookings as a percentage of total bookings is a reliable metric, even when individual attribution is uncertain. If marketing activity is working, this number should be moving in the right direction over time. If it isn't moving, something needs adjustment.
Cost per direct booking, blended. Total marketing spend divided by total direct bookings, calculated quarterly. This is a blunt number, but it's honest and it's harder to fool yourself with. Over time, the trend tells you whether your marketing is becoming more efficient or less.
Repeat and referral booking rates. The share of bookings coming from prior guests or their referrals is a marketing measurement that doesn't require attribution. It either grows or it doesn't, and growth here is direct evidence that the customer experience plus the marketing program is generating compound returns.
OTA share of total bookings. Whether your OTA dependency is growing or shrinking over time, regardless of total volume. Marketing that's actually working should, over time, shift this ratio.
These five numbers are the ones I'd put on a wall and look at every month. They don't tell you which specific ad caused which specific booking. They do tell you whether the marketing program as a whole is producing the outcomes you actually care about.
The Three Attribution Models Worth Knowing
For specific campaigns and tactics, three attribution approaches are worth understanding, with honest acknowledgement of their limitations.
Last-touch attribution. What most dashboards default to. The last interaction before the booking gets full credit. This is what Google Analytics will tell you by default. The problem: it dramatically overweights the bottom-of-funnel tactics (branded search, retargeting) and underweights the awareness tactics (display, social, content) that actually built the demand in the first place.
Last-touch isn't useless. It just isn't a full picture. Use it for what it's good at (optimising bottom-of-funnel spend) and don't trust it for what it's bad at (deciding whether your brand-building investments are working).
First-touch attribution. The first interaction gets full credit. The mirror image of last-touch, with the opposite bias. Useful for understanding which channels are introducing new customers to your business. Limited because most customers have multiple "first" touches.
Blended or rule-based attribution. Where credit gets divided across multiple touchpoints, usually with weights set by the operator's judgment. More accurate but more arbitrary. Some operators use this to give partial credit to OTAs even on direct bookings (because the customer might have first encountered the brand through the OTA), and partial credit to direct activity even on OTA bookings.
The honest principle: no attribution model is fully right. The least-misleading approach for most operators is to look at multiple attribution models, notice where they disagree, and apply judgment about the underlying customer behaviour rather than picking the one that gives the most flattering result.
The Brand-Search Trap
A specific measurement issue worth understanding.
When customers search "[your business name] tours" on Google, your Google Ads campaign often shows up alongside the organic result. Customers click the ad, land on your site, book. Your Google Ads dashboard reports a converted booking and a positive ROI.
The trap: most of those customers were searching for you specifically. They were going to find your site whether or not the ad existed. The Google Ads campaign is, in effect, paying for traffic that would have arrived for free through the organic listing.
This is one of the most common ways operators believe their paid ads are working when they aren't. The fix isn't to stop bidding on brand terms entirely (there are defensive reasons to do so, including blocking competitors from showing up above your organic listing), but to recognise that the conversion attribution from brand-search ads is mostly illusion.
A more honest view of your Google Ads ROI excludes branded search conversions from the calculation, or at minimum looks separately at non-brand search performance. The latter is the real measure of whether the ads are generating incremental demand.
What the Honest Marketing Dashboard Looks Like
If you wanted to build the most honest possible monthly marketing review for a tour operator with mixed OTA and direct distribution, it would look something like this.
Five top-level metrics, tracked over time:
- brand search volume
- direct share of bookings
- blended cost per direct booking
- repeat and referral rate
- OTA share of bookings
A channel-level view that acknowledges its own limitations: best-guess contribution by channel, with explicit notes about which contributions are confident and which are estimates.
A separate view of any specific campaigns or experiments that have a measurable counterfactual. A geographic test, a time-based pause, an A/B comparison. These tell you something with more confidence than always-on spend ever can.
A note on the dark funnel: the share of bookings that came in with no measurable marketing touch, which over time can be used as a rough proxy for the strength of your word-of-mouth and brand recall.
This dashboard isn't going to give you the clean ROI number you'd like to have. It will give you a more honest picture than the dashboards that pretend to, which is more useful in the long run.
The Experiments That Actually Work
Given the limitations of always-on attribution, the most reliable way to measure specific marketing tactics is through deliberate experimentation.
Geographic holdout tests. Run a campaign in some markets and not others. Compare bookings from each. The difference is your real lift, with attribution-free clarity.
Time-based pauses. Turn a channel off for a defined period, look at what happens to bookings. The decline (if any) is your real attribution to that channel, net of substitution effects.
Match-pair comparisons. Run two versions of the same campaign with different creative or different audience, compare outcomes directly.
These experiments take more discipline than the always-on dashboards, but they produce real causal information rather than correlation. Operators who run two or three deliberate experiments a year learn more about what's actually working than operators who watch their dashboard daily.
A Closing Thought
The honest truth about marketing measurement in our industry is that we operate with more uncertainty than the marketing literature would suggest. The OTA dark funnel, the word-of-mouth invisibility, the brand-search illusion, the multi-touch reality, all of these mean that any operator claiming precise ROI numbers is probably overconfident.
The framing that holds up: marketing measurement isn't about precise causal attribution. It's about directional clarity over time.
- Are the metrics that matter (direct share, brand search, repeat rate) moving in the right direction?
- Is the cost per direct booking trending favourably?
- Is the dependency on any single channel growing or shrinking?
These questions have answers, even when the underlying customer journey is murky. The operators who focus on the answerable questions tend to make better marketing decisions than the ones who try to chase precision the data can't support.
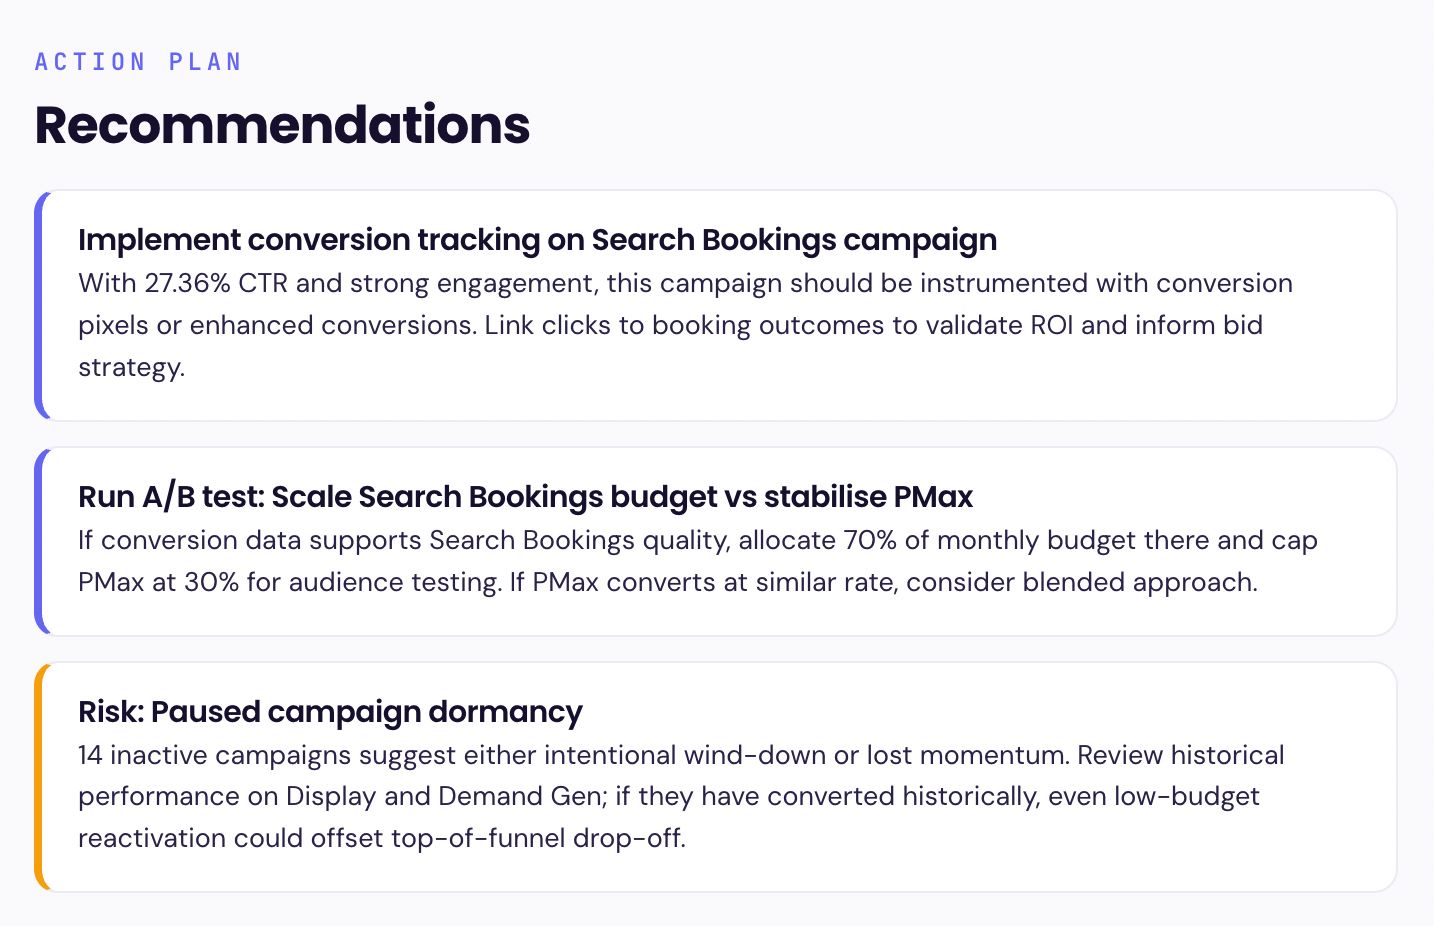
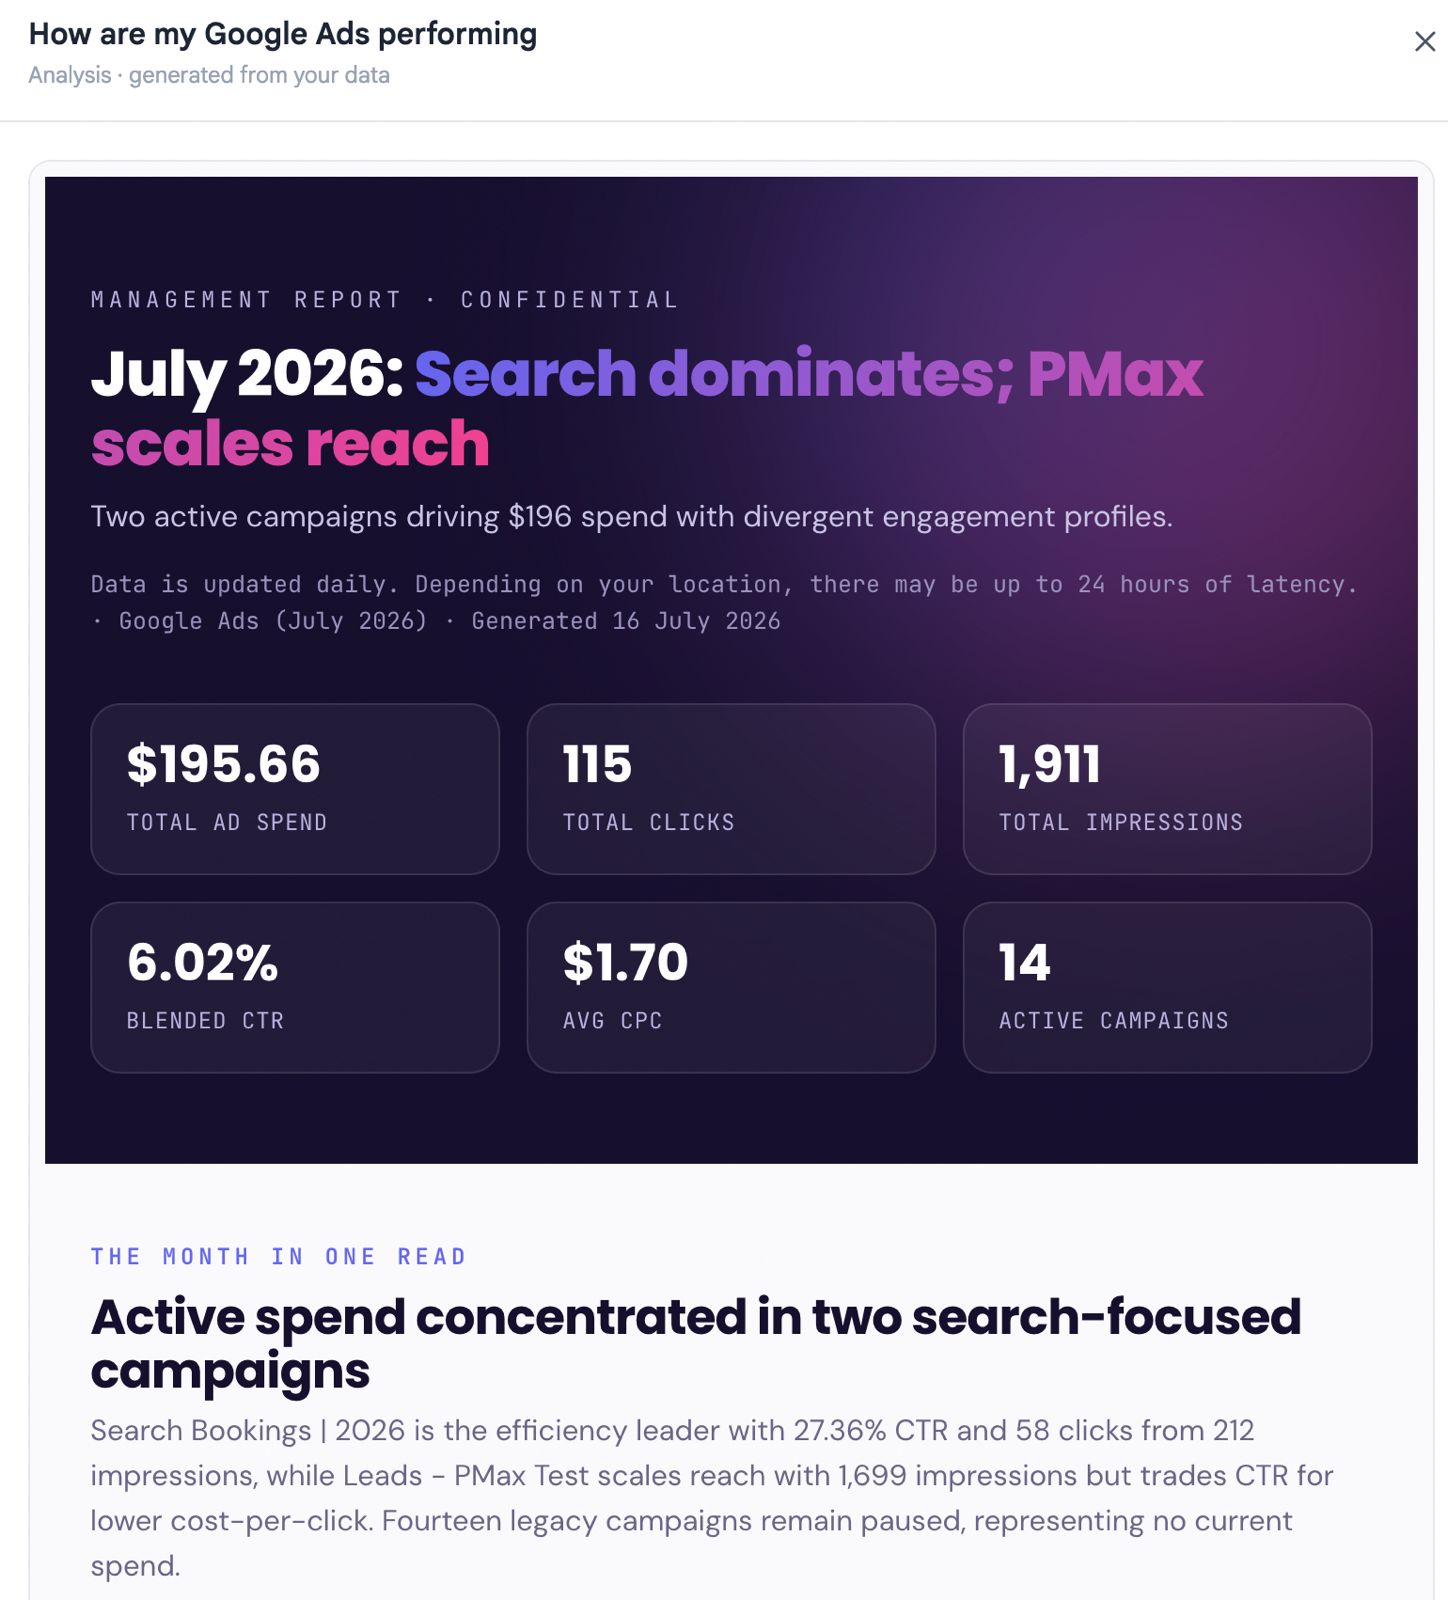
Dazhboards' sales tracking module pulls together the direct-channel data, the OTA reporting, and the marketing spend in one place so the directional view is available without manual spreadsheet assembly. The deeper attribution problem stays hard; the operational view of what's happening at least becomes possible to see clearly. Also providing actionable insights and recommendations, this tool is your go to for Marketing Analytics.